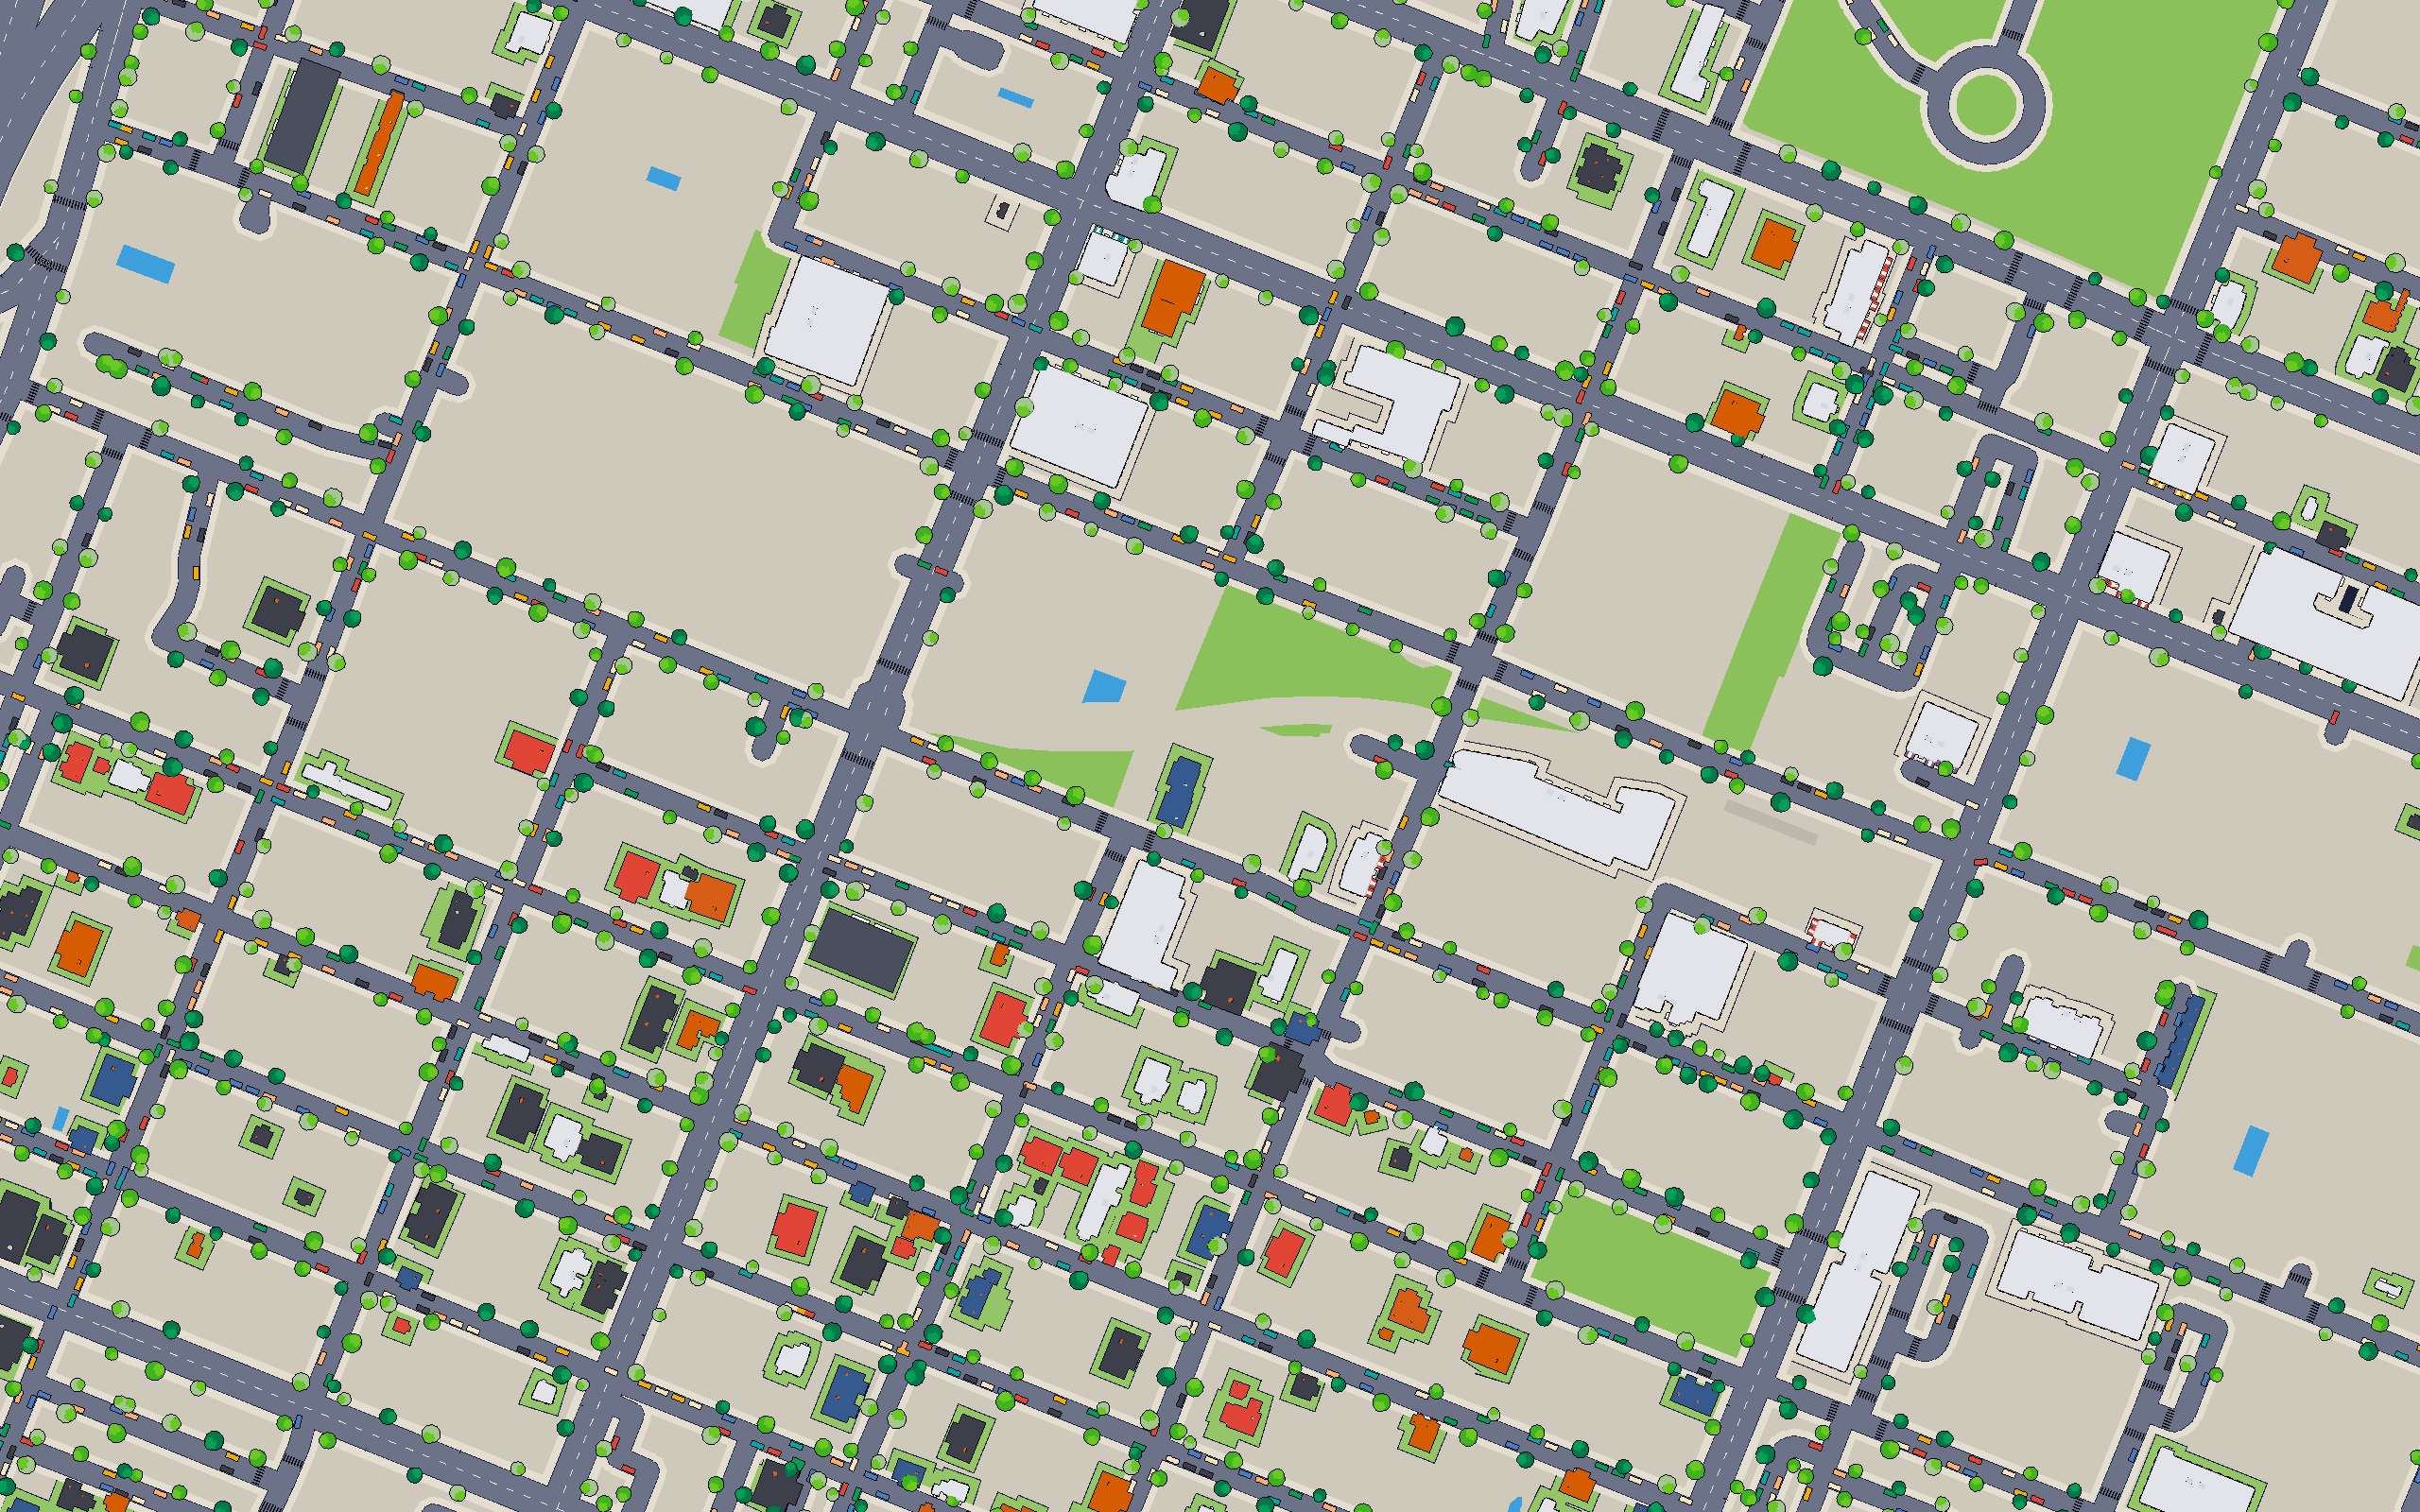
Every building here is a real building.
Central Austin, from OpenStreetMap — the same streets and buildings you buy and hold in the game, through decades of recorded market history.
Map © OpenStreetMap contributors, ODbL · Every source
A place, not a spreadsheet.
Most tools ask you to type assumptions into a form and hand back one number. PropertyLab puts you in a real metro with real building stock and runs the clock: you shop, borrow, let, repair, refinance and sell through recorded market history from 1980 forward, at the rates that actually applied in the year you are standing in.
Then the consequences arrive on their own schedule — a tenant who stops paying in month nine, a roof in year four, a refinance window that opens for eleven months and closes. That is the part a calculator cannot show you, because a calculator only holds one moment.
- 1980
- Where history startsFed funds, CPI, 30/15/5-year mortgage rates, unemployment, rental vacancy and Case-Shiller, straight from FRED.
- 7
- Lending erasWhich loan products existed, and on what terms, changes as the simulation crosses decades. No subprime 2/28 in 1985.
- 5
- Case studiesDated situations with real starting conditions — including going in before the 2008 crash and trying to come out solvent.
- 28,584
- Austin footprintsReal parcels in the shipped city file — the buildings the city above is drawn from.
Private beta · v0.1.0 alpha · Buildings © OpenStreetMap contributors, ODbL · Every source · Terms · Privacy